Someone from your best team is already thinking about leaving.
This might shock you, and you probably won't see it coming. It's not that the signs aren't visible; it's that they're buried in systems that report the past instead of signaling the future.
Now that's the gap HR analytics bridges.
When done right, the analytics turns the existing data of your HR systems (engagement scores, tenure patterns, recognition gaps, and performance trends) into a real-time strategy briefing. It is not a quarterly report, but more like a living view of what's happening with your people, and where things are headed.
The best HR teams do not measure turnover after it happens. They capture it 90 days prior. They spot the high performers who feel invisible, and why one team thrives while the other suffers burnout. And the most significant step is that they act on it before it costs them.
This article will shed light on how exactly the analytics function works: the four analytics types that separate reactive reporting from proactive culture design, the metrics most HR teams overlook, and how companies are turning data into lasting, measurable change.
What Is HR Analytics (and What It Isn't)
HR analytics is a data-driven approach to managing people that connects workforce data to business outcomes. It generates information on hiring patterns, engagement scores, recognition activity, turnover rates, and analyzes the root causes behind what is driving them to increase or decrease.
HR analytics vs. people analytics vs. workforce analytics These terms always create a confusion as they are often used interchangeably. But here's how they differ.
HR analytics typically refers to operational HR data (hiring, turnover, engagement). People analytics, on the other hand, is broader. It encompasses all employee lifecycle data. Workforce analytics extends further to include contingent workers and labor planning.
What HR analytics is NOT:
- Annual headcount reports that tell you what happened six months ago
- Satisfaction surveys alone without behavioral correlation
- Vanity metrics like "total awards given" without coverage rates
- Data dumps without actionable recommendations
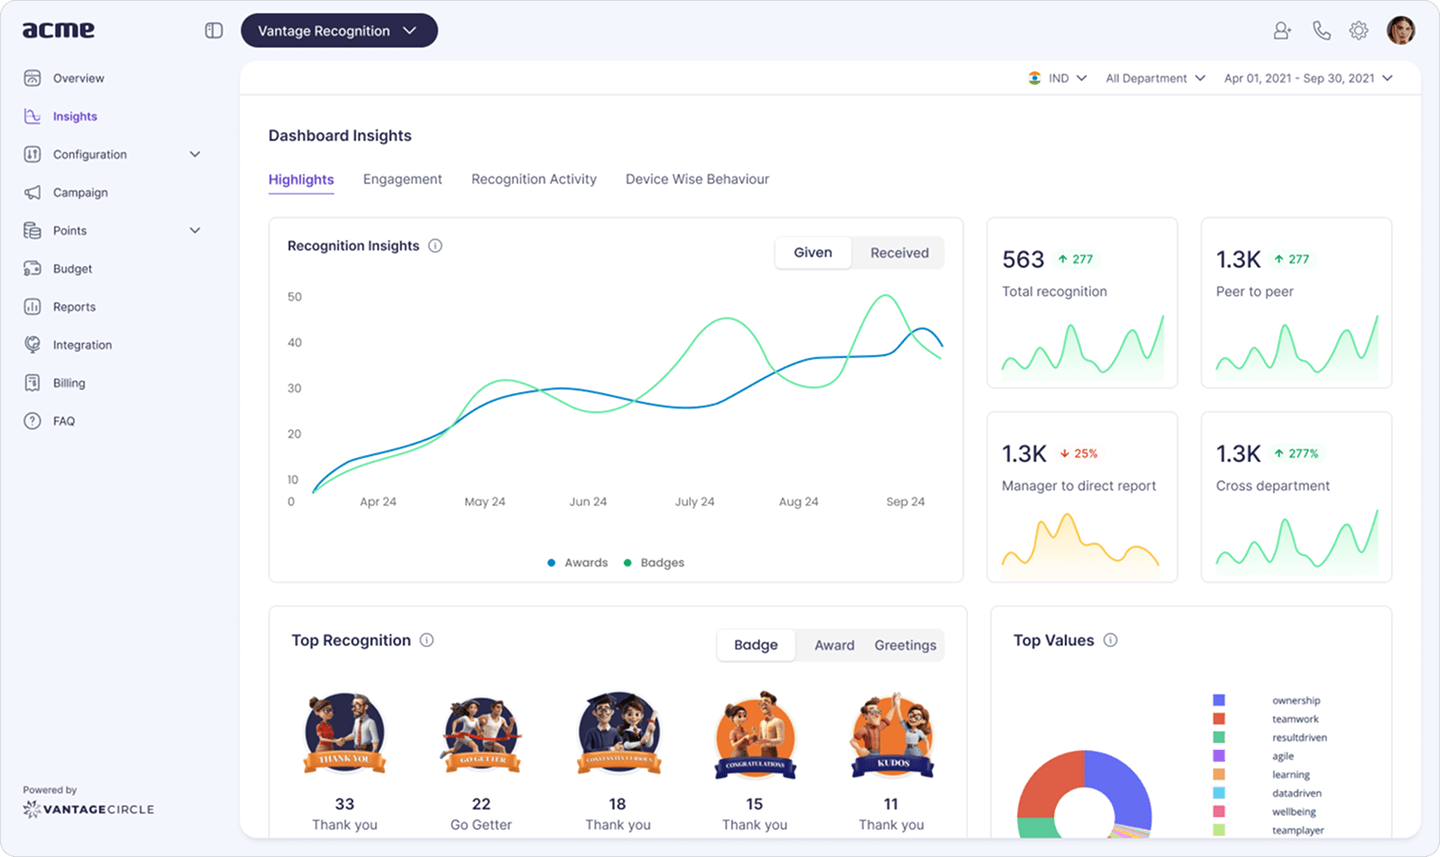
Here's the shift that has occurred: the question is no longer about "how many awards did we give?" but "who is being recognized, who isn't, and how does it correlate with retention?" That is the difference between measuring output and measuring culture health.
The 4 Types of HR Analytics (With Real Examples)
HR analytics operates across four levels, each contributing to the next. Understanding all four give HR leaders the upper hand to progress from reactive reporting to proactive culture design.
Descriptive Analytics: "What happened?"
Descriptive analytics analyses past data to explain trends and patterns. It is the foundation of all HR analytics.
Real example: Wipro's quarterly recognition report showed that 57% of employees received at least one recognition in the fiscal year. That is descriptive analytics revealing coverage rates at enterprise scale (230,000+ employees across 66 countries). Over two years (2021-2023), Wipro recorded 553,490+ total awards through their Winners' Circle program.
Diagnostic Analytics: "Why did it happen?"
Diagnostic analytics digs beneath the surface to explain the patterns descriptive data reveals. It unveils root causes behind the numbers.
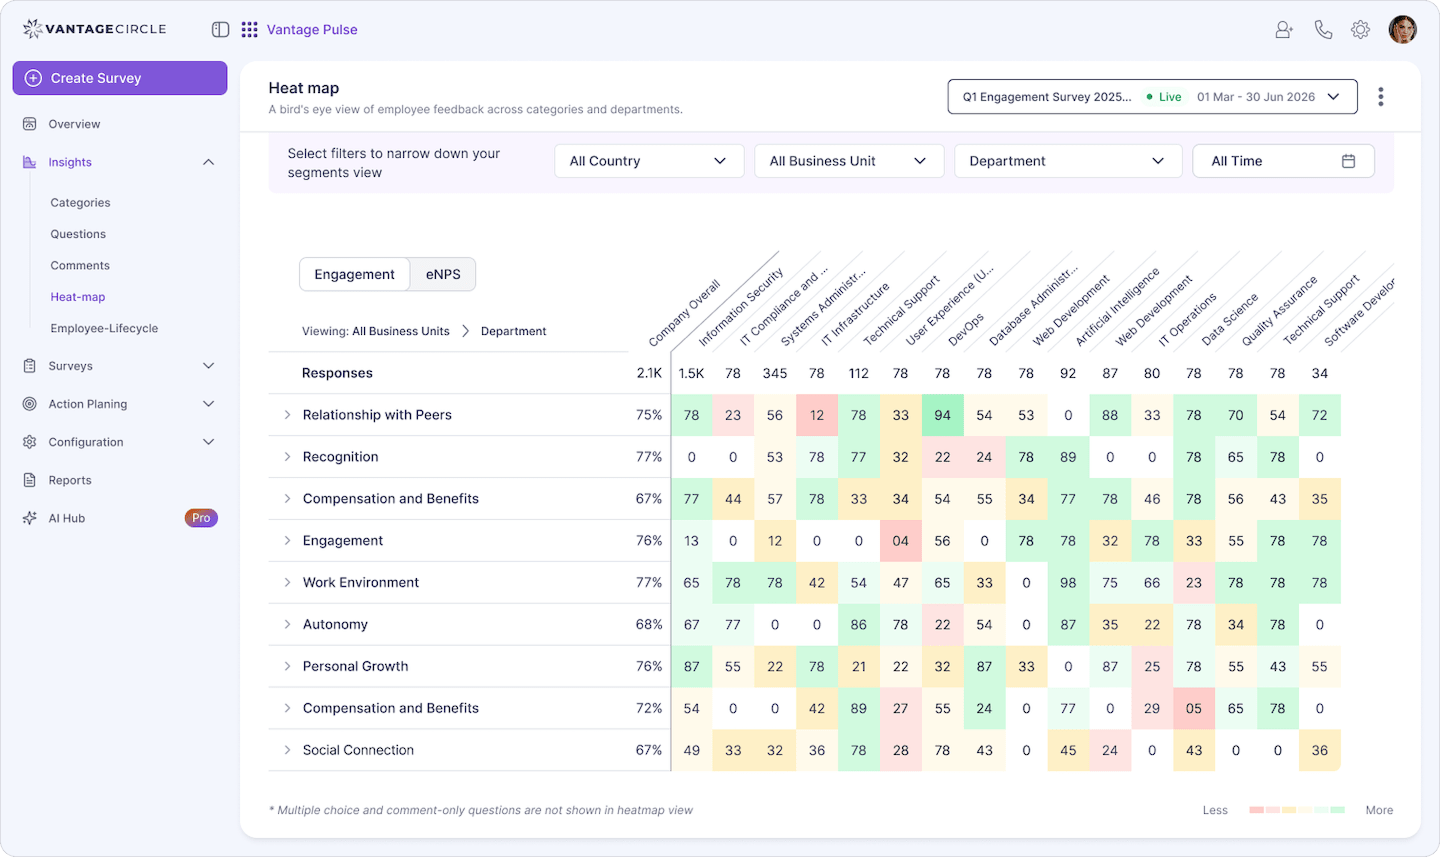
Real example: A department heatmap in Vantage Circle's analytics dashboard reveals that engineering teams have 30% lower giver coverage than sales teams. The root cause: engineering managers rarely log into the recognition platform. The fix: targeted manager training and Teams integration to reduce friction.
Predictive Analytics: "What might happen?"
Predictive analytics utilizes data modeling to forecast future outcomes based on historical patterns.
Real example: AI identifies employees who haven't received peer recognition in 90+ days and flags them as flight risks before engagement surveys surface the problem.
Prescriptive Analytics: "What should we do?"
Prescriptive analytics recommends concrete actions based on data insights.
Real example: Cross-product analytics reveals that teams with high recognition frequency show eNPS scores 15 points higher than teams with low recognition activity. The prescription: increase peer recognition campaigns in underperforming departments and track the eNPS movement over the next two survey cycles.
The Metrics Most HR Teams Miss
Most HR teams track turnover rates, eNPS scores, and time-to-hire. Those are lagging indicators. They tell you what has already happened. By the time the problem surfaces, that problem will have been built and festered for months.
The leading indicators that predict culture health are different. They capture what is happening right now, before it becomes a retention event or an engagement crisis. Here are those metrics:
1. Receiver Coverage % — What percentage of employees received recognition in the measurement period? (AIRe benchmark: 70%+)
2. Giver Coverage % — What percentage of managers and peers gave recognition? (AIRe benchmark: 40%+)
3. Recognition Frequency — How often does recognition happen organization-wide? (Target: daily)
4. Program Usage % — Are employees actually engaging with the platform? (AIRe benchmark: 60%+)
These four metrics are called the North Star Metrics. They come from the AIRe Framework research dataset across 700+ organizations in 100+ countries. They capture the full recognition culture loop: giving, receiving, frequency, and adoption.
The CHRO Test: If your analytics dashboard tracks total awards given but not giver coverage or receiver coverage, you are measuring activity, not culture.
What These Metrics Look Like at Enterprise Scale
These are not hypothetical benchmarks. These North Star Metrics have been tracked through analytics dashboards by the five enterprise programs from day one. It demonstrates what these numbers look like in practice.
- 57% receiver coverage across 230,000 employees
- 1 recognition every 1.2 minutes (2023)
- 553,490+ total awards in 2 years
- 240,000+ employee base
- 15% improvement in employee engagement
- 40% platform engagement at launch
- Recognition-driven culture adoption across distributed teams
- 78,000+ employees
- 82% rise in peer-to-peer recognition
- Enhanced recognition culture across manufacturing and corporate divisions
- Improved connectivity across geographically dispersed workforce
- 220,000+ employees across 110 countries
- 53% improvement in employee recognition rates
- Increased engagement across hospitality operations globally
- Scaled recognition program across diverse work environments
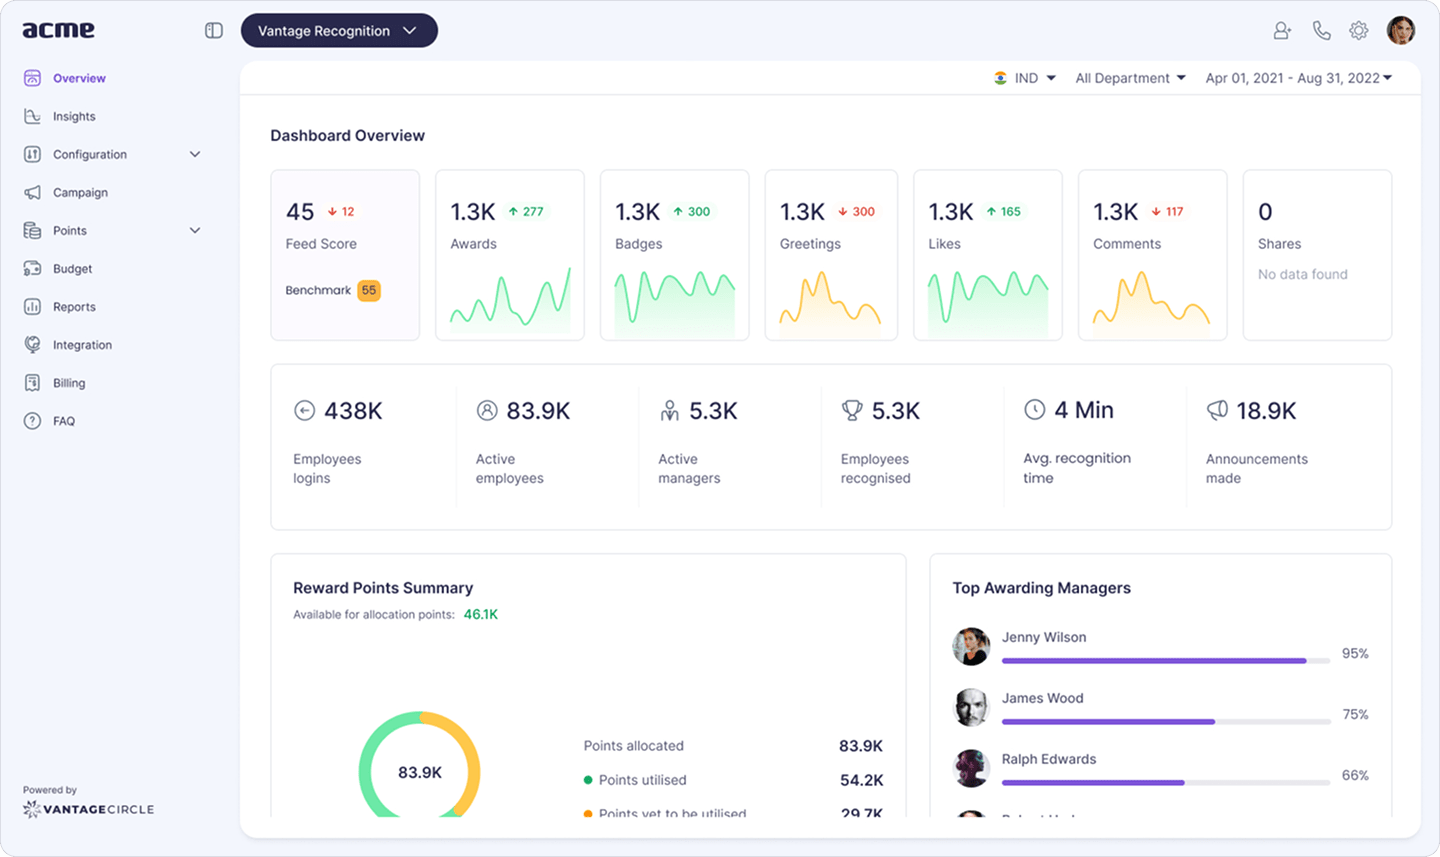
What connects these results? Analytics identified gaps early. Coverage reports revealed which departments were underserved. Frequency data showed whether recognition was habitual or one-off. Budget analytics ensured equitable distribution across teams and levels.
AI and Cross-Product Analytics: Where HR Data Is Heading
Two shifts are significantly redefining HR analytics in 2026:
AI-powered predictive analytics:
Machine learning models are adept at identifying flight risk employees before engagement surveys even catch the problem. AI-driven recognition systems flag under-recognized team members and surface manager prompts. This elevates analytics from a reporting function into a proactive leadership tool. The HR team is no longer relying on last quarter's data. They are acting on a signal that today's data is currently generating.
Cross-product data integration:
Siloed analytics (recruitment-only, survey-only) give incomplete pictures. Integrated platforms correlate recognition data with eNPS scores, perks engagement, and wellness participation. The metric that matters: cost per engaged employee, a composite that CFOs understand.
Recognition-driven cultures show 92% retention vs 76% in low-recognition cultures (AIRe report). That correlation only becomes visible when recognition data and retention data live in the same analytics layer.
The CHRO's HR Analytics Checklist
Here are four questions every CHRO should be able to answer using their analytics.
- What percentage of employees received recognition last quarter? (Receiver Coverage %) If you cannot answer this with a specific number, your analytics program does not track receiver coverage. That is a foundational metric, and its absence means you have no baseline for culture health.
- What percentage of managers are actively giving recognition? (Giver Coverage %) Giver coverage predicts whether recognition is a leadership behavior or an HR initiative that only activates around performance review cycles. These are not the same thing, and analytics should tell you which one you have.
- Is recognition frequency correlated with eNPS in our organization? (Cross-product correlation) This question separates descriptive programs from predictive ones. If your analytics cannot correlate recognition activity with engagement outcomes in your specific organization, you are relying on industry benchmarks rather than your own data.
- What is our cost per engaged employee? (Total program cost divided by active users) This is the CFO question. It converts cultural investment into a number that belongs in a business case. If your analytics program cannot produce it, you are making the case for engagement spend without the evidence that justifies it.
If you are unable to answer these questions, consider that your analytics program has gaps. Not a tooling gap but a measurement gap.
Analytics without action is just reporting. Monthly Quarterly Business Reviews tie data to program adjustments. So, the gap between "we have a dashboard" and "we have a program that improves" is the action loop.
Conclusion
HR analytics is not data just for data's sake. It is the evidence layer that informs HR leaders whether their programs are actually building culture or they're merely spending budget.
The organizations getting it right track North Star Metrics, act on what the data shows, and review monthly, not annually. They can answer the CHRO's four questions without having to pull data from five different spreadsheets.
See what HR analytics looks like in practice. Book a Vantage Circle Demo to see how enterprise programs track recognition coverage, eNPS correlation, and cross-product engagement in a single dashboard.
Recommended Resource: Best HR Analytics Tools in 2026: Pricing, Features & More
Frequently Asked Questions
What is HR analytics?
HR analytics is the practice of collecting, analyzing, and reporting workforce data to improve decision-making and business outcomes. It transforms raw HR data into actionable insights on hiring, engagement, retention, and recognition, enabling HR leaders to make evidence-based decisions instead of relying on intuition or anecdotal evidence.
What are the 4 types of HR analytics?
The four types are: (1) Descriptive analytics — what happened, using past data to explain trends; (2) Diagnostic analytics — why it happened, uncovering root causes; (3) Predictive analytics — what might happen, forecasting future outcomes; (4) Prescriptive analytics — what should we do, recommending concrete actions based on data insights.
What is the difference between HR analytics and people analytics?
HR analytics typically refers to operational HR data like hiring, turnover, and engagement metrics. People analytics is broader, encompassing all employee lifecycle data including performance, learning, and career progression. Workforce analytics extends further to include contingent workers and labor planning. For most HR leaders, the distinction matters less than the quality of insights generated.
What metrics should HR track with analytics?
Beyond standard metrics like turnover rate and time-to-hire, HR should track leading indicators: Receiver Coverage % (what percentage received recognition), Giver Coverage % (what percentage gave recognition), Recognition Frequency (how often recognition happens), and Program Usage % (platform engagement). These North Star Metrics predict culture health before lagging indicators like turnover reflect problems.
How does HR analytics improve employee retention?
HR analytics improves retention by identifying flight risks before employees resign, revealing which departments have engagement gaps, and correlating recognition activity with retention data. Organizations using predictive HR analytics see 30% higher retention (Gartner). Recognition-driven cultures show 92% retention vs 76% in low-recognition cultures (AIRe report).
How do recognition analytics differ from traditional HR metrics?
Traditional HR metrics (turnover, time-to-hire, eNPS) are lagging indicators that tell you what already happened. Recognition analytics are leading indicators that predict culture health: who is being recognized, who is being left out, and how recognition patterns correlate with engagement and retention. Recognition analytics answer "are we building a culture where employees actually give and receive recognition?" — a question traditional metrics cannot answer.

This article is written by Riha Jaishi. Riha Jaishi is a Content Marketing Specialist at Vantage Circle and host of the HR Vantage Influencers podcast, sharing insights that help organizations build recognition-rich, people-first cultures!!
Connect with Riha on LinkedIn.